
What this page answers
Filler substitution is presented as a purchasing decision and it is actually a compounding decision, because every kilogram of carbon black you remove takes a set of properties with it and you have to decide which ones you are willing to rebuild. This page works through one replacement route in detail: a surface activated nano flake filler used partly in place of carbon black or a mineral filler in EPDM, NBR, BIIR and natural rubber. It covers the measured results in a tyre inner liner where 20 phr replaced 10 phr of N660, in an EPDM braided hose where 80 phr replaced kaolin, and in EPDM and NBR screening at 130 phr and 60 phr. It also sets out the four questions a functional filler for rubber supplier should be able to answer from its own records, and the process variables that decide whether a substitution works in your plant or only on the test report.
Why the cost calculation goes wrong first
Filler decisions usually start with a price per kilogram, and a price per kilogram cannot answer the question that was asked. Three corrections are needed before any comparison is meaningful.
Cost per part, not per unit weight. Two fillers at the same price per kilogram but different densities give different part weights, and a filler with a lower price and a higher density can be the more expensive one. The comparison has to be run on cost per unit volume of finished compound.
The total filler package, not one ingredient. In the inner liner trial described below, N660 was reduced from 60 phr to 50 phr and 20 phr of nano filler was added. The total filler content went up by 10 phr, the density went from 1.135 to 1.179 g/cm³, and the cost saving came from the package rather than from the price of the substituted material. A calculation that looks at the substituted ingredient alone will get the sign right and the size wrong.
Processing and variability as separate lines. Lower Mooney viscosity at equal or higher loading reduces mixing energy and improves extrusion rate. Poor dispersion produces defects that surface downstream as scrap and rework. Neither appears in a compound cost sheet, and both are larger than the material saving in some plants.
The coupled stress problem at the filler surface
A filled rubber part does not experience heat, oxygen and cyclic load separately. It experiences them together, and the filler particle is where they interact.
Cyclic strain concentrates at the particle because the filler is far stiffer than the matrix. Local heat builds up. Heat accelerates oxidation. Oxidation stiffens the matrix. A stiffer matrix concentrates more strain at the same particle. The loop closes and accelerates, and it is the reason a compound can pass every time zero specification and still underperform in year two.
Three consequences follow, and they explain why two fillers with the same particle size certificate can behave differently in service.
Strain concentration controls fatigue. A sharper stiffness mismatch between filler and rubber raises the local strain at the particle. An agglomerate behaves as one large particle with the same sharp boundary, so poor dispersion is a fatigue variable rather than an appearance variable.
Heat build-up controls the aging rate. The temperature at the interface during dynamic service is higher than the temperature measured in the oven.
Interfacial chemistry controls how long it holds. A filler surface that bonds weakly to the polymer creates a weak boundary layer. Oxygen and water reach it first, and the bond degrades before the bulk polymer does.
A filler evaluation that measures tensile strength at time zero measures the outcome of all three effects without measuring any of them.
A search written as a replace carbon black filler factory is really a search for the substitution ratio and the property consequence, and both depend on the surface treatment of the mineral rather than on the mineral grade. Where the substitution is a mineral for a mineral, the ratio is close to one to one on weight and the constraint is usually hardness or compression set rather than strength. Where the substitution is a mineral for carbon black, the reinforcement level of the replacement grade sets the ratio, and the activated surface is what determines how much of the black can come out before the compound loses the property the black was there to provide.
What a surface activated flake filler does differently
This filler class is produced from selected high whiteness natural composite mineral raw materials, refined to a nanoscale particle size distribution, and given a surface activation treatment. Any nano reinforcing filler manufacturer China or elsewhere will make the same three claims about reinforcement, processing and aging behaviour. Two structural features matter more than the particle size number.
An activated interface. Untreated mineral fillers are hydrophilic and bond poorly to non-polar rubber, so the interface behaves as a discontinuity. Surface activation shifts that interface from a boundary to a bonded region. This is the mechanism behind the reinforcement level claimed for this family, which is close to N550 carbon black rather than to kaolin or light calcium carbonate.
A flake structure with high porosity. Flake particles pack into a tortuous path, so any small molecule moving through the compound, whether it is oxygen, water vapour or plasticiser, travels further. That is the structural basis of the barrier improvement measured in the inner liner trial, and it is also the reason a high loading is possible without the compound becoming unprocessable.
| Performance dimension | Conventional route: carbon black top-up, kaolin, light calcium carbonate | Surface activated nano flake filler |
| Reinforcement mechanism | Particle size and structure, physical entanglement | Activated interface plus flake geometry |
| Reinforcement level | High for carbon black, limited for kaolin and light calcium carbonate | Approaches N550 |
| Mooney viscosity at equal loading | Rises with loading | Lower at equal or higher loading |
| Colour | Black for carbon black, variable for minerals | High whiteness, suitable for light coloured parts |
| Barrier behaviour | Determined by the polymer | Tortuous path from flake structure |
| Compression set | Rises with high black loading | Low |
| Electrical behaviour | Conductivity depends on the black grade | High surface and volume resistivity |
| Odour | Carbon black odour in some compounds | Low odour |
| Loading ceiling | Limited by viscosity and stiffness | High filling rate possible |
The grades in the family, and how they differ
A rubber filler manufacturer China that offers one grade is offering a compromise. This family is organised by cure system and by whiteness, and the differences between grades are larger than the differences between families in some properties.
| Grade | Surface treatment | Median particle size | Conventional whiteness, GEM | pH in aqueous solution | Chemistry | Position in the family |
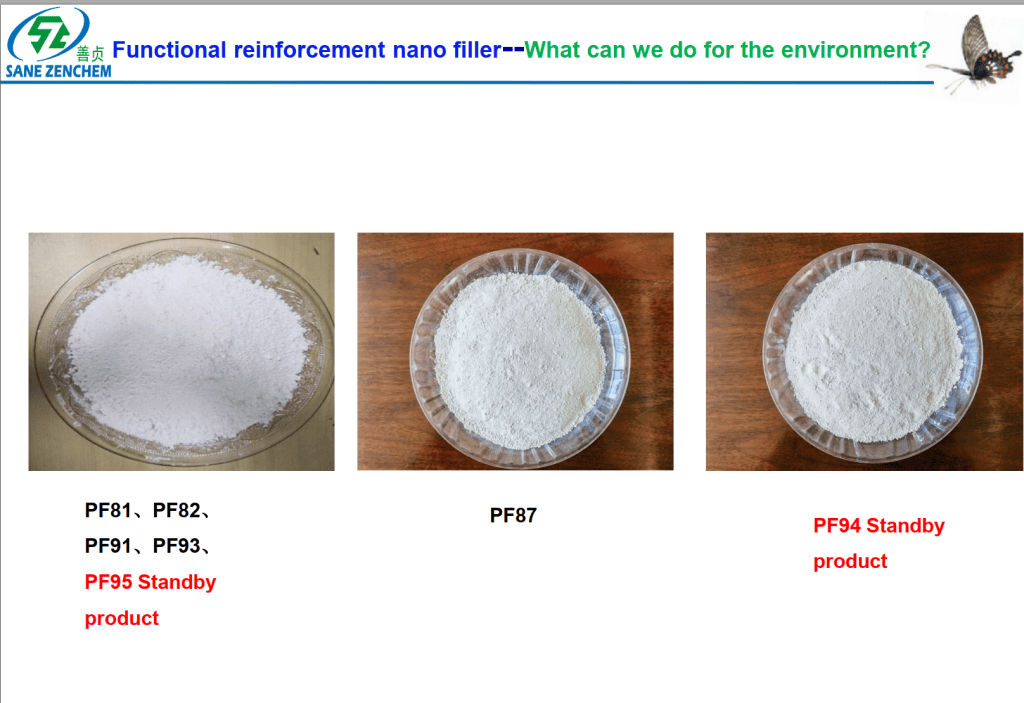
| PF87 | Dehydroxylated, activated | D50 153 nm, D10 73 nm | 71 | 5.95 | SiO₂ 50.30%, Al₂O₃ 34.50%, TiO₂ 1.60% | General purpose, barrier and fatigue applications |
| PF81A | Dehydroxylated, activated | 800 nm | 94 | 6 to 7 | SiO₂ 55%, Al₂O₃ 42%, TiO₂ 1% | Highest whiteness, reinforcement slightly above N660, lowest compression set |
| PF82 | Dehydroxylated, activated | 800 nm | 80 | 6 to 8 | SiO₂ 55%, Al₂O₃ 42%, TiO₂ 1.2% | Reinforcement slightly above N550, insulation |
| PF91 | Silane treated | 790 nm | above 91 | 6 to 8 | SiO₂ 53.3%, Al₂O₃ 44.5%, TiO₂ 0.9% | Sulfur curing systems |
| PF93 | Silane treated | within the same range | high | within the same range | within the same range | Peroxide curing systems |
| PF90 | Ultra nano, high whiteness | in the ultra nano range | highest in the family | within the same range | within the same range | Coatings, inks, polymers and papermaking as well as rubber |
Two observations from that table. First, the particle size number on its own does not rank the grades. PF87 has the finest median particle size and PF81A has the coarsest, and PF81A is the grade with the highest reinforcement and lowest compression set in the EPDM comparison because the surface treatment and the mineral selection dominate. Second, the silane treated grades exist because the surface chemistry has to match the cure system. A grade optimised for a sulfur cure will behave differently in a peroxide cure, and the difference shows up in cure behaviour rather than in the unaged tensile strength.

The general dosage range is 30 to 150 phr, and the working rule from the data sheet is that 8 to 10 phr raises hardness by roughly one Shore A. Establish the loading window in a two point trial rather than extrapolating, because the packing structure changes as the loading rises.
Measured substitution in a tyre inner liner
An inner liner is the clearest case for a functional filler because the governing requirement is barrier performance rather than stiffness, and the traditional answer is carbon black. A tire inner liner filler supplier is asked for one property above all others, and it is not tensile strength. The trial reduced N660 from 60 phr to 50 phr and added 20 phr of PF87, with everything else held constant including the cure system.
| Item | Control, 60 phr N660 | With 20 phr PF87 and 50 phr N660 |
| Mooney ML(1+4) at 100 °C | 56.3 | 53.6 |
| t5 at 125 °C, minutes | 29.8 | 29.3 |
| T35 at 125 °C, minutes | 66.1 | 68.8 |
| ML at 151 °C, dN·m | 1.12 | 0.98 |
| MH at 151 °C, dN·m | 4.29 | 4.07 |
| TS1 at 151 °C, minutes | 7.43 | 8.49 |
| TS2 at 151 °C, minutes | 15.37 | 16.25 |
| T90 at 151 °C, minutes | 20.17 | 21.30 |
| Hardness, Shore A | 55 | 55 |
| Tensile strength, MPa | 10.1 | 10.9 |
| Elongation at break, % | 758 | 752 |
| 100% modulus, MPa | 1.1 | 1.1 |
| 300% modulus, MPa | 3.1 | 3.0 |
| Tear strength, kN/m | 33 | 32 |
| Density, g/cm³ | 1.135 | 1.179 |
| Tensile strength after 100 °C × 48 h, MPa | 9.3 | 9.9 |
| Tear strength after aging, kN/m | 29 | 26 |
| Elongation after aging, % | 712 | 707 |
| Air permeability, m³/(m²·d·Pa) | 12.73 | 11.32 |
| Permeability coefficient, ×10⁻¹⁴ cm³·cm/(cm²·s·Pa) | 16.53 | 15.43 |
| Flex crack resistance to 500,000 cycles, grade | 0 | 0 |
Four readings, in the order a compounder would take them.
Processing improved while total filler content rose. Mooney viscosity fell from 56.3 to 53.6 MU with 10 phr more filler in the compound, which is the opposite of what happens when you top up carbon black. In a plant this shows as lower mixing energy and easier extrusion.
The cure window stayed usable and became slightly more forgiving. Scorch time at 125 °C was effectively unchanged at 29.3 against 29.8 minutes, TS1 and TS2 both lengthened on the rheometer, and the optimum cure time moved from 20.17 to 21.30 minutes. A 1.1 minute shift is small enough to absorb in an existing cycle and large enough that it should be re-verified on the production cure profile rather than assumed.
Physical properties were equivalent or slightly better. Hardness matched exactly, tensile strength rose from 10.1 to 10.9 MPa, elongation was within 1%, and tear strength was within 1 kN/m. The density rise from 1.135 to 1.179 g/cm³ is the cost of the extra 10 phr of total filler and has to be carried in a weight based costing.
Barrier performance improved, which was the point of the trial. Air permeability fell about 11% and the permeability coefficient moved in the same direction. Air retention is the property an inner liner exists to deliver, so an 11% improvement at equal or better mechanical properties is the commercially relevant result rather than the small tensile gain. Flex crack resistance was equivalent to the control to 500,000 cycles at grade 0, so the barrier improvement did not cost fatigue resistance.
The wider formulation study on the same application tested PF87 at 22, 35 and 50 phr in two inner liner bases, replacing light calcium carbonate in one series and reducing N660 in the other. Falling to a summary of that work: compared with the calcium carbonate control, the PF87 compounds showed reduced maximum and minimum torque, extended scorch time, higher modulus and tensile strength, better aging resistance and a small decrease in glass transition temperature. Air permeability moved in a range between a 6.2% improvement and a 26.0% worsening depending on the formula, with the net result improving as PF87 content rose.
Screening across EPDM and NBR
The inner liner is one application. Across other base polymers the family shows a consistent pattern, and the pattern is the useful information.
In an EPDM sulfur system at 130 phr functional filler loading, the grades in the family separated widely on the same formulation.
| Property, EPDM sulfur system at 130 phr | PF87 | PF91 | PF93 | PF81 |
| ML, dN·m | 0.71 | 0.66 | 0.65 | 0.67 |
| MH, dN·m | 7.46 | 9.10 | 8.83 | 8.17 |
| TS2, seconds | 52 | 48 | 34 | 41 |
| TC90, seconds | 172 | 122 | 114 | 97 |
| Hardness, Shore A | 59 | 63 | 59 | 59 |
| 100% modulus, MPa | 2.55 | 3.69 | 2.38 | 2.25 |
| Tensile strength, MPa | 15.87 | 10.99 | 10.85 | 7.90 |
| Elongation at break, % | 667 | 433 | 576 | 550 |
| Density, g/cm³ | 1.265 | 1.275 | 1.302 | 1.267 |
| Tensile change after 100 °C × 70 h air aging, % | −12.67 | +9.01 | +1.94 | −2.66 |
| Elongation change after aging, % | −22.19 | −30.25 | −14.93 | −19.64 |
| Compression set, 100 °C × 24 h, % | 46.67 | 23.33 | 20.00 | 33.33 |
| Surface resistivity, Ω | 7.52 × 10¹⁴ | 4.73 × 10¹⁴ | 2.17 × 10¹⁵ | 9.10 × 10¹⁴ |
| Volume resistivity, Ω·cm | 7.28 × 10¹⁵ | 1.01 × 10¹⁵ | 2.16 × 10¹⁵ | 2.22 × 10¹⁵ |
Tensile strength ranged from 7.90 to 15.87 MPa across grades in the same formulation at the same loading, which is a factor of two. Compression set ranged from 20.00% to 46.67%. Cure time ranged from 97 to 172 seconds. Three grades, three different products, one family. Grade selection inside the family matters as much as the decision to use the family at all.
In NBR the ranking changes, which is the reason to test in your own base polymer.
| Property, NBR sulfur system at 60 phr | PF87 | PF81 | PF91 | PF93 |
| ML, dN·m | 0.78 | 0.82 | 0.83 | 1.05 |
| MH, dN·m | 9.78 | 11.13 | 14.02 | 12.96 |
| TS2, seconds | 59 | 77 | 66 | 73 |
| TC90, seconds | 111 | 151 | 134 | 146 |
| Hardness, Shore A | 67 | 67 | 68 | 68 |
| 100% modulus, MPa | 3.98 | 2.83 | 3.74 | 3.81 |
| Tensile strength, MPa | 18.44 | 13.34 | 15.27 | 14.91 |
| Elongation at break, % | 698 | 710 | 596 | 664 |
| Density, g/cm³ | 1.320 | 1.340 | 1.341 | 1.363 |
| Hardness change after 120 °C × 24 h, Shore A | 5 | 0 | 2 | 2 |
| Tensile change after 120 °C × 24 h, % | −9.49 | −11.02 | −20.37 | −14.15 |
| Elongation change after 120 °C × 24 h, % | −20.06 | −6.90 | −29.03 | −13.40 |
| Compression set, 100 °C × 24 h, % | 17.24 | 13.79 | 10.34 | 10.34 |
Compression set at 100 °C for 24 hours ranged from 10.34% to 17.24% in the same formulation. For a seal or a gasket that range is the difference between a part that works and a part that takes a set, and it is the reason to select a low compression set filler manufacturer on test data at the service temperature rather than on a property description.
Where filler loading replaces a process problem: EPDM braided hose
A hose compound is a different brief again, and it shows a benefit that does not appear in any mechanical property.
| Material | phr |
| EPDM | 100 |
| Light calcium carbonate | 100 |
| N550 carbon black | 10 |
| Nano flake filler | 80 |
| Paraffin oil | 50 |
Hose hardness was 65 to 70 Shore A. The industry problem in this application is not strength, it is migration: small molecules from the compound bleed to the surface, contaminate the braided reinforcement and discolour the finished hose. At 80 phr, the flake structure reduced the mobility of those small molecules enough that no migration to the braided layer occurred, and the hose showed better elasticity and recovery in handling. That is a case where the flake geometry delivers something a spherical filler cannot deliver at any loading, and a white reinforcing filler for rubber with a different morphology would not reproduce it.
Dispersion, and why the same filler gives two different results
Everything above assumes the filler ends up where it is supposed to be, and that assumption is where results diverge between plants.
An agglomerate is not a small version of a filler particle. It is a defect. It has a sharp stiffness boundary, it concentrates cyclic strain, and in a dynamically loaded part it is a crack initiation site. On a tensile bar the compound can still meet specification, because the failure path may avoid the agglomerate. In a flexing part in service it will not, and in a flame retardant or barrier compound the local concentration of the filler is also wrong, which changes the local performance rather than only the mechanical result.
Three process variables decide the outcome, and none of them appear on a filler data sheet.
Shear history in the first stage. Filler and polymer need enough shear to break agglomerates down to primary particles or small aggregates. Adding filler late, or running a short first stage cycle, produces a compound that looks acceptable and behaves inconsistently.
Addition sequence. A filler with an activated surface interacts with the cure system, so the point at which it is added relative to activators, accelerators and plasticisers affects both dispersion and cure behaviour. The inner liner trial moved the optimum cure time by more than a minute, which is small, and a change in the addition sequence can move it further.
Loading level. A filler with a high loading ceiling can be pushed further than a carbon black replacement, but the mixing cycle has to be adjusted for the filler rather than the other way round.
The practical recommendation is to validate dispersion during the trial, not properties alone. A compound that passes at 20 phr with good dispersion is a different product from one that passes at 20 phr with visible agglomerates, even when the test report is identical.
How to read a particle size report for a rubber filler
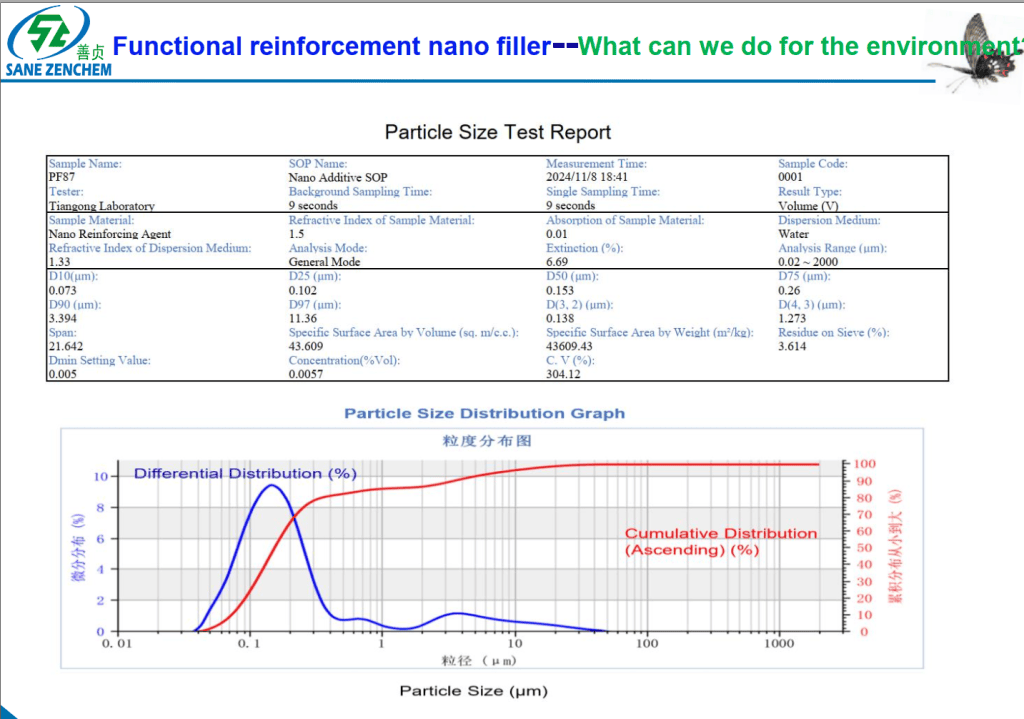
A third party particle size measurement on this grade, carried out by laser diffraction in water with a refractive index of 1.5 and reported on a volume basis, gave the following distribution.
| Parameter | Value |
| D10 | 0.073 µm |
| D25 | 0.102 µm |
| D50 | 0.153 µm |
| D75 | 0.260 µm |
| D90 | 3.394 µm |
| D97 | 11.36 µm |
| D(3,2), surface area mean | 0.138 µm |
| D(4,3), volume mean | 1.273 µm |
| Span | 21.642 |
| Specific surface area by weight | 43,609 m²/kg, about 43.6 m²/g |
| Residue on sieve, percent | 3.614 |
Two numbers in that report deserve attention and they point in opposite directions. The D50 of 153 nm confirms the nanoscale median and matches the data sheet value. The D90 of 3.394 µm and the span of 21.6 describe a distribution with a coarse tail, and a filler with a coarse tail can contain oversize particles that show up as surface defects on an extruded part. The residue on sieve figure independently confirms that a small fraction of the material is above the 45 µm sieve.
This is the part of a filler evaluation that a certificate cannot replace. A single median value looks good in a comparison table; the distribution shape decides how the filler behaves on an extruded surface. Ask for the full distribution and the sieve residue, and check the sieve residue against your own incoming inspection limit.
Which grade to choose
Start from the cure system, then from the colour requirement, then from the property that governs the part.
For a sulfur cured compound where the requirement includes heat aging and compression set, the silane treated sulfur system grade is the intended match. For a peroxide cured compound the corresponding peroxide grade exists because the surface chemistry has to be compatible with the crosslinking mechanism. Using a sulfur optimised grade in a peroxide system is a common and avoidable source of failure.
For a white reinforcing filler for light coloured rubber products, whiteness becomes a governing property because a grey or yellow cast in the raw filler becomes a visible defect in the finished part. The two grades with conventional whiteness above GEM 80 are the candidates, and the highest whiteness grade in the family reaches GEM 94. A high whiteness rubber filler supplier should be asked for a cured plaque rather than a powder photograph, because the compound shifts the colour and the powder sample does not show it.
For a barrier application, the general purpose grade with the finest median particle size is the intended match, as the inner liner trial shows. For a part where compression set is the limit, the grade with the lowest compression set in the EPDM comparison is the starting point, and its reinforcement level is also higher than the general purpose grade.
For a part where cost is the only driver and the mechanical requirement is modest, a mineral filler is still the right answer. There is no argument for a surface activated nano filler in a compound that does not need the interface.
The total cost of ownership argument
Four terms belong in a filler comparison, and only one of them is quoted.
Material cost per part. Work in cost per unit volume and carry the density shift. In the inner liner trial the density moved from 1.135 to 1.179 g/cm³ as total filler content rose by 10 phr, and that has to be in the calculation.
Processing cost. Lower Mooney viscosity at equal or higher loading reduces mixing energy and improves extrusion rate, and where a plant runs close to its mixing capacity this term can exceed the material saving. A filler that shortens cure time moves the line rate as well.
Scrap and variability cost. Poorly dispersed filler produces defects that surface downstream in extrusion appearance or in service, and the cost lands as rework and rejects rather than as a line item.
Field failure cost. A part that fails early carries replacement labour, downtime and warranty exposure. The relevant figure is the cost of one premature failure divided by the number of parts it would have to affect before the material saving is erased.
In this family the two terms that can be measured before you commit are processability and property retention after aging, and in the data above both move in the favourable direction, with lower Mooney viscosity at higher filler content and equal or better aged properties. The other two terms need input from the service environment of the part.
FAQ
How to replace carbon black without losing tensile strength
Replace part of it rather than all of it, and check the aging slope rather than the time zero number. In the inner liner trial, reducing N660 from 60 phr to 50 phr and adding 20 phr of nano filler raised unaged tensile strength from 10.1 to 10.9 MPa and post aging tensile strength from 9.3 to 9.9 MPa, while lowering Mooney viscosity from 56.3 to 53.6 MU. The benefit comes from the total filler package rather than from one ingredient, and the density shift has to be included in the costing. Confirm the result in your own base polymer before changing a production compound.
How much carbon black can a nano filler replace in EPDM
It depends on which carbon black and which property is the constraint, and the answer should be established by a two point trial. In the EPDM screening work at 130 phr functional filler loading the grades held hardness between 59 and 63 Shore A and delivered tensile strength between 7.90 and 15.87 MPa, so the grade choice moves the answer more than the loading does in the first instance. Where carbon black is being replaced rather than a mineral filler, expect the substitution ratio to be closer to one to one on a weight basis for the general purpose grades, and confirm it against hardness and compression set rather than tensile strength alone.
White reinforcing filler for light coloured rubber products
Whiteness is the governing property, and it separates the grades in this family more than particle size does. Conventional whiteness across the range runs from GEM 71 to GEM 94. A raw filler with a grey or yellow cast produces a visible defect in a white or pastel finished part, so select on measured whiteness and confirm it against a cured plaque rather than against a powder sample, because the compound can shift the colour.
Filler for tire inner liner to improve air retention
A flake filler contributes a tortuous diffusion path rather than only a stiffness increase, and that is the mechanism behind the measured result. Air permeability fell from 12.73 to 11.32 m³/(m²·d·Pa) in the BIIR inner liner trial, roughly 11%, with the permeability coefficient moving in the same direction. Flex crack resistance was equivalent to the control to 500,000 cycles, so the barrier gain did not cost fatigue resistance. Re-verify on your own blend, because barrier performance depends on the polymer combination as well as the filler.
How to add filler without raising Mooney viscosity
Use a filler with a flake structure and high porosity, and add it early enough in the first stage to be dispersed properly. In the inner liner trial Mooney viscosity fell from 56.3 to 53.6 MU while total filler content rose by 10 phr. In the EPDM screening work the maximum torque across grades at 130 phr ranged from 7.46 to 9.10 dN·m, which is a modest band for a compound at that loading. If Mooney viscosity rises in your plant, the first explanation to test is dispersion and the second is addition sequence, before the filler grade.
How to reduce compound cost per part not per kilogram
Convert every filler to cost per unit volume, include the density of the finished compound, and add the processing and scrap terms. A filler with a lower price per kilogram and a higher density is not automatically cheaper per part, and a filler that lowers Mooney viscosity or shortens cure time changes the plant cost even when the raw material price is unchanged. In the inner liner case the density moved from 1.135 to 1.179 g/cm³, which has to be carried in any weight based costing.
Nano filler that keeps compression set low in NBR seals
Compression set is the property that decides a seal, and it varies widely across grades in the same formulation. In an NBR sulfur system at 60 phr, compression set at 100 °C for 24 hours ranged from 10.34% to 17.24% across four grades, with hardness within one Shore A and tensile strength between 13.34 and 18.44 MPa. Select the grade on compression set at your service temperature rather than on tensile strength, and confirm it after aging because the aged hardness change also varied, from 0 to 5 Shore A.
Which PF grade for sulfur curing and which for peroxide curing
The silane treated grades exist in two versions for exactly this reason, one matched to sulfur curing and one matched to peroxide curing. Using a grade optimised for one cure system in the other is a common cause of unexpected cure behaviour, because the activated surface interacts with the crosslinking chemistry. Confirm the cure system with the supplier before requesting a sample, and include a rheometer comparison with the filler in and out in the trial.
Filler to stop small molecule migration in EPDM braided hose
Flake geometry is what addresses this problem, because the tortuous path resists the movement of small molecules to the surface. In an EPDM extruded braided hose at 65 to 70 Shore A, 80 phr of the flake filler replaced the existing kaolin with no migration to the braided layer and no discolouration, and the hose showed better elasticity and recovery in handling. A spherical filler at the same loading would not reproduce the result, so the morphology rather than the loading is the controlling variable.
How to read a particle size report for a rubber filler
Read the distribution and not the median. A third party report on the general purpose grade in this family gave D10 of 0.073 µm, D50 of 0.153 µm, D90 of 3.394 µm and a span of 21.6, with a sieve residue of 3.614%. The D50 confirms the nanoscale median and the D90, span and sieve residue describe a coarse tail that can produce surface defects on an extruded part. Ask for the full distribution and the residue figure, and set an incoming inspection limit on both.
Does the filler change the cure system
Yes, and the size of the effect should be measured rather than assumed. In the inner liner trial the optimum cure time moved from 20.17 to 21.30 minutes and scorch time at 125 °C was essentially unchanged. In the EPDM screening work at 130 phr the optimum cure time ranged from 97 to 172 seconds across grades in the same formulation, which is a wide band. Add a rheometer run with the filler in and out to the trial protocol, because a filler that changes the cure also changes the state of cure.
How much filler can be added before hardness becomes the limit
The working rule from the data sheet is that 8 to 10 phr raises hardness by roughly one Shore A, and the general dosage range is 30 to 150 phr. Hardness rises with loading regardless of filler type beyond a certain point, because the filler network becomes continuous. Establish the two point window in your own compound and treat the loading ceiling as the point where hardness, Mooney viscosity or compression set leaves the specification window, not the point where the filler stops dispersing.
Does the filler affect electrical properties
Yes, and in the direction a mineral filler implies rather than the direction a conductive carbon black implies. In the EPDM sulfur system at 130 phr, surface resistivity sat between 4.73 × 10¹⁴ and 2.17 × 10¹⁵ Ω and volume resistivity between 1.01 × 10¹⁵ and 7.28 × 10¹⁵ Ω·cm. In the NBR sulfur system at 60 phr the same measurements were lower, in the 10¹¹ to 10¹⁴ range, which is a property of the NBR base rather than of the filler. If the compound is replacing a conductive black grade, confirm the insulation requirement before specifying.
What standards apply to the source data
Mechanical and cure testing in the source data follows [参考标准,如 GB/T 528 / ASTM D412 for tensile properties], [GB/T 529 / ASTM D624 for tear strength], [ASTM D2240 / GB/T 531.1 for hardness], [ASTM D395 / GB/T 7759 for compression set], [ASTM D573 for heat aging], [GB/T 533 / ASTM D792 for density], [ASTM D5289 for cure characteristics], [GB/T 1038 / ISO 15105-1 for gas permeability] and [GB/T 13934 / ISO 132 and ISO 6943 for flex cracking]. Particle size was measured by laser diffraction. Please confirm the applicable edition and specimen geometry before quoting a standard in a purchase specification.
Technical support and resources
Where the data comes from. The inner liner results are a two compound comparison in a BIIR and NR blend, plus a six formula study in the same application at 22, 35 and 50 phr. The EPDM and NBR results are multi-grade screening programmes in sulfur cured reference compounds at 130 phr and 60 phr respectively. The particle size figures are from an independent laboratory report on the general purpose grade. Every number quoted is a measured value from those programmes and the conditions are stated next to each table.
Two points need confirmation before publication. First, the third party RoHS 2.0 and REACH SVHC reports on file list several grades from this family in their sample description and do not name the general purpose grade individually. Please confirm with the testing laboratory whether the grade you are promoting is covered by the same report or needs a separate test. Second, the particle size report includes a coefficient of variation of 304% and a sieve residue of 3.614%. Both are consistent with a distribution that has a coarse tail, and both should be checked against the specification limit before the report is published as a quality document.
A filler decision is formulation specific. The loading window, the aging slope, the cure behaviour and the density penalty all depend on the base polymer, the cure system and the part geometry. For a two point evaluation protocol matched to a specific compound, or for a dispersion and aging study on your own material, technical support is available through the contact below.
The surface activated nano flake filler family discussed on this page is supplied as the GreenThinking® PF series, covering grades for EPDM, NBR, NR and other systems.
 English
  Spanish
  Russian